The use of the tool is described in Wheaton et al. (In Review), and reviewed here briefly. The video tutorials below go through all the steps in using the tool. There are over 250 different sample datasets (as of Fall 2011) you can try the tool out on available at http://champmonitoring.org.
If you have unprojected survey data, that includes coordinates for three benchmarks for which you also have projected or geographic coordinates for, you can use this tool (i.e. any initial CHaMP survey). It helps if you have some context projected imagery or basemap layers for your study area. This video covers how you load such imagery to prepare to use the tool:
After you have your base imagery loaded for context, you are ready to use the tool. You may do this with either CHaMP or non-CHaMP data. The next two video tutorials show you how to do this.
Prior to using the tool, I used CHaMP Tools toolbox -> Survey Data Processing -> 1 Import Data from .DXF File to get the survey data ready (wffoser_4.20.2011_tq3.dxf in this case) and convert it into a Geodatabase with the unprojected data. For the video tutorial above I used this WestFork_FosterCreek.gdb Geodatabase from West Fork of Foster Creek. This WFFoster.csv file has the coordinates for doing the transformation.
If you are interested in using non CHaMP data with this tool, see this video:
For a more elaborate explanation of the use of the tool, see the Lab 2 Exercise from a GIS Class taught at USU.
Screenshots
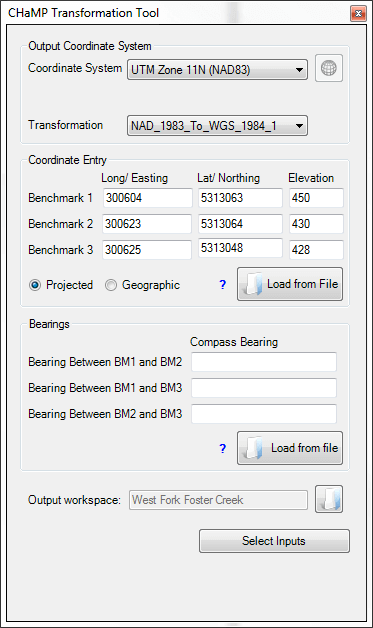
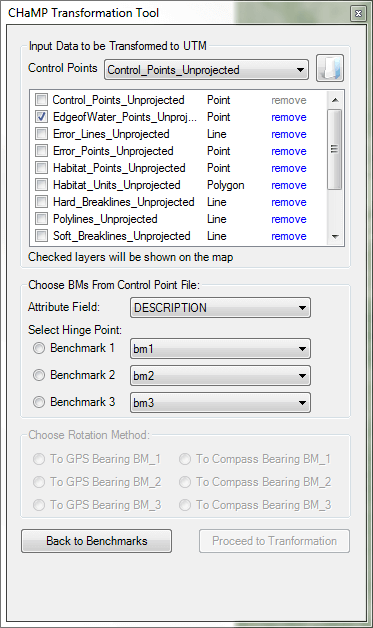
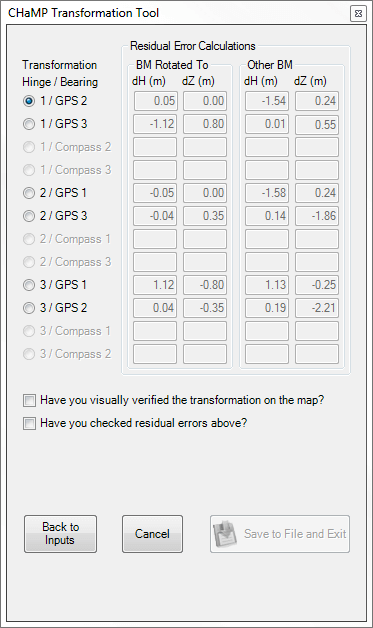
The Add-In is a dockable panel with ArcGIS and consists of three primary screens:
In the First Screen you load your benchmark coordinates, and specify the workspace where your unprojected data is:

The second screen prompts you to choose what data you want to preview, and how you want to initially calculate the transformation:

The final tool lets you interactively decide what is the most appropriate transformation method based on a combination of visual inspection and inspection of the residual error values:

